Way back in 2016, Greg Glassman published this simple chart, and to be honest it never made any sense to me. It was in my CrossFit Level 1 manual and I had seen it referenced from time to time in the CrossFit Journal. Greg’s visualization could have been better, but his point couldn’t be any more profound. Fitness and Wellness can be measured based on a Sum of health markers. The higher the sum, the greater your level of fitness and wellness.

How do you Raise the Sum of your Health Markers?
Eat meat and vegetables, nuts and seeds, some fruit, little starch, and no sugar. Keep intake to levels that will support exercise but not body fat.
Practice and train major lifts: Deadlift, clean, squat, presses, C&J (clean and jerk), and snatch. Similarly, master the basics of gymnastics: pull-ups, dips, rope climbs, push-ups, sit-ups, presses to handstands, pirouettes, flips, splits, and holds. Bike, run, swim, row, etc. hard and fast.
Five or six days per week mix these elements in as many combinations and patterns as creativity will allow. Routine is the enemy. Keep workouts short and intense.
Regularly learn and play new sports.
Greg Glassman, Level 1 Manual
To make that simpler, I think there are really only six things you need to improve your health markers.
- Practice CrossFit (classes or personal training) 4-5 days per week.
- Work on your mobility 1-2 hours per week.
- Follow a quality nutrition plan.
- Get 8-10 hours of sleep per day.
- Manage emotional and physical stress.
- Get 5,000-10,000 steps in every day.
Of course, there are caveats and exceptions to these six rules. For example, if you prefer to swim instead of walking, that will reap much the same benefit. And, if you are walking uphill, you probably don’t need 10,000 steps.
Sickness-Wellness-Fitness Continuum
One can plot overall health as function of various health markers. For example, consider the table below. I’ve listed 7 health markers, but there are many more one can use1. I’ve also included a range of values these health markers can be. In full disclosure, all of this research comes directly from CrossFit and Level 1 manual.
| Parameter | Sickness | Wellness | Fitness |
|---|---|---|---|
| Body Fat (percent) | >25 (male) >32 (female) | ~18 (male) ~20 (female) | ~6 (male) ~12 (female) |
| Blood Pressure (mm/Hg) | >140/90 | 120/80 | 105/60 |
| Resting Heart Rate (Pulse) (bpm) | >100 | 70 | 50 |
| Triglycerides (mg/dL) | >200 | <150 | <100 |
| Low-density Lipoprotein (mg/dL) | >160 | 120 | <100 |
| High-density Lipoprotein (mf/dl) | <40 | 40-59 | >60 |
| ECW/TBW (Inflammation) | >0.37 | 0.36-0.38 | <0.36 |
| SMM | <100 | 100-120 | >120 |
| InBody Score | >70 | 71-89 | <90 |
| Visceral Fat Level | <14 | 7-13 | >7 |
| VO2Max | <38 | 39-50 | >50 |
If we assign one point for sickness, two points for wellness, and three points. We generate the following chart.
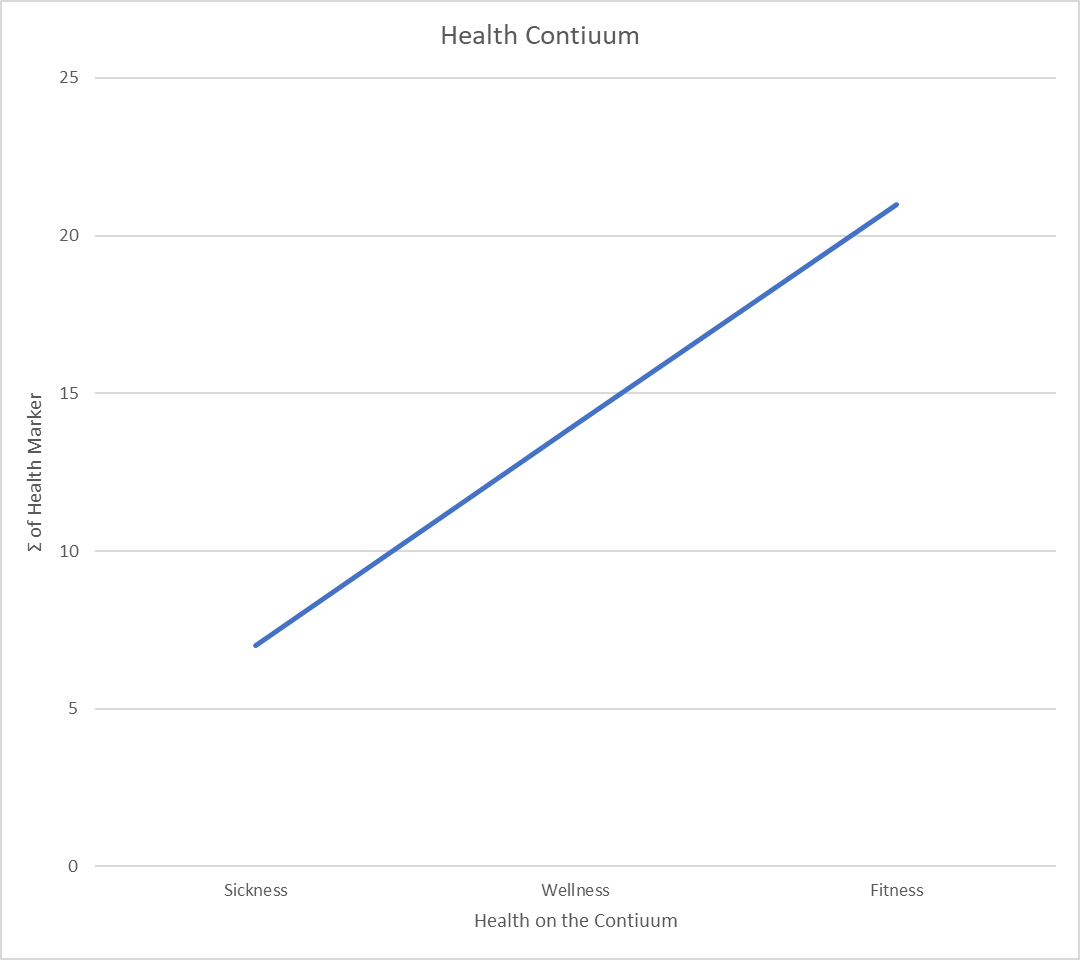
So the higher you score on the graph (y-axis), the more fit you are and the longer you will live (probably).
VO2Max Example
For example, on average 77% of people lived for 10 years after their mid 50s with a VO2max in the “sickness” level was 77%. Whereas the 97% percent of people lived for 10 years after their mid 50s with a VO2max in the “fitness” level.
VO2 max, or maximal oxygen consumption, refers to the maximum amount of oxygen that an individual can utilize during intense or maximal exercise. This measurement is generally considered the best indicator of cardiovascular fitness and aerobic endurance. The more oxygen a person can use during high level exercise, the more energy a person can produce
Resting Heart Rate Example
A resting heart rate of 100 is a sign of sickness, or more specifically, a warning sign that you are at risk for metabolic syndrome (the collection of diseases that you are at risk for when you are inactive and overweight). The higher your resting heart rate, the higher the risk for developing certain illnesses. Conversely the lower your heart rate, the lower the risk. It can be inferred from Glassman’s article that the benefit of lowered health risk tapers off at a certain level. Probably 70 bpm. However, one could also presume that an athlete with a resting heart rate of 50bpm will outperform an athlete with a resting heart rate 70pm.
What’s the Bottom Line?
CrossFit outlines four primary definitions of fitness. Your performance on the 10 general physical skills, performance on the hopper, metabolic performance on three metabolic pathways, and this one — the sickness-wellness-fitness continuum. In my own practice, I see a direct correlation between an athlete’s performance on the hopper and how well they score on sickness-wellness-continuum.
- I use Body Fat Percentage, Muscle Mass, Blood Pressure, Resting Heart Rate, InBody Score, and Inflammation in our Welcome Pack ↩